source("scripts/R/cdi-plot-theme.R")

library(ggplot2)
library(dplyr)

counts_df <- read.csv("data/demo-counts.csv", check.names = FALSE)
rownames(counts_df) <- counts_df[, 1]
counts_df <- counts_df[, -1, drop = FALSE]
counts <- as.matrix(counts_df)
storage.mode(counts) <- "numeric"

metadata <- read.csv("data/demo-metadata.csv", stringsAsFactors = FALSE)

library_size <- colSums(counts)
norm_counts <- sweep(counts, 2, library_size, "/") * 10000
log_counts <- log1p(norm_counts)

gene_vars <- apply(log_counts, 1, var)
var_order <- order(gene_vars, decreasing = TRUE)
variable_genes <- rownames(log_counts)[var_order[1:200]]

pca_input <- t(log_counts[variable_genes, ])
pca_res <- prcomp(pca_input, center = TRUE, scale. = FALSE)

set.seed(123)
clusters <- kmeans(pca_res$x[, 1:2], centers = 3)$cluster
clusters <- factor(clusters)Marker Genes and Variance-Driven Separation
Why This Lesson Matters
In Lesson 4, we saw that:
- PCA amplifies selected variance.
- Clusters reflect compressed variance space.
- Structure emerges from highly variable genes.
Marker analysis now asks:
Which genes are responsible for the separation we observe?
Markers do not create clusters.
They explain the variance that created them.
Load Data and Recompute Structure
What Marker Analysis Really Tests
Clusters represent regions of compressed variance space.
Marker testing asks:
Which genes contribute most to that separation?
If a gene is a strong marker, it must:
- Exhibit consistent expression difference between clusters
- Contribute to amplified variance
- Align with PCA-driven structure
Markers quantify the structure created by selected variance.
Differential Expression: Cluster 1 vs Others
cluster_id <- "1"

group1 <- which(clusters == cluster_id)
group2 <- which(clusters != cluster_id)

marker_results <- data.frame(
  gene = rownames(log_counts),
  logFC = NA_real_,
  pvalue = NA_real_
)

for (i in seq_len(nrow(log_counts))) {
  g1 <- as.numeric(log_counts[i, group1])
  g2 <- as.numeric(log_counts[i, group2])

  marker_results$logFC[i] <- mean(g1) - mean(g2)

  tt <- tryCatch(
    suppressWarnings(t.test(g1, g2)),
    error = function(e) NULL
  )

  marker_results$pvalue[i] <- if (is.null(tt)) NA_real_ else tt$p.value
}

marker_results$padj <- p.adjust(marker_results$pvalue, method = "BH")
marker_results$significant <- !is.na(marker_results$padj) & marker_results$padj < 0.05
Volcano Plot: Quantifying Separation
volcano_df <- marker_results %>%
  mutate(neglog10_padj = -log10(padj))

sig_cutoff <- -log10(0.05)

ggplot(volcano_df, aes(x = logFC, y = neglog10_padj)) +
  geom_point(aes(color = significant), alpha = 0.8) +
  scale_color_manual(values = c("FALSE" = "grey70", "TRUE" = "#036281")) +
  geom_vline(xintercept = 0, linetype = "dashed") +
  geom_hline(yintercept = sig_cutoff, linetype = "dashed") +
  labs(
    title = "Marker gene volcano plot",
    subtitle = "Markers quantify variance-driven separation",
    x = "Mean difference (Cluster 1 minus others)",
    y = "-log10(adjusted p-value)"
  ) +
  cdi_theme()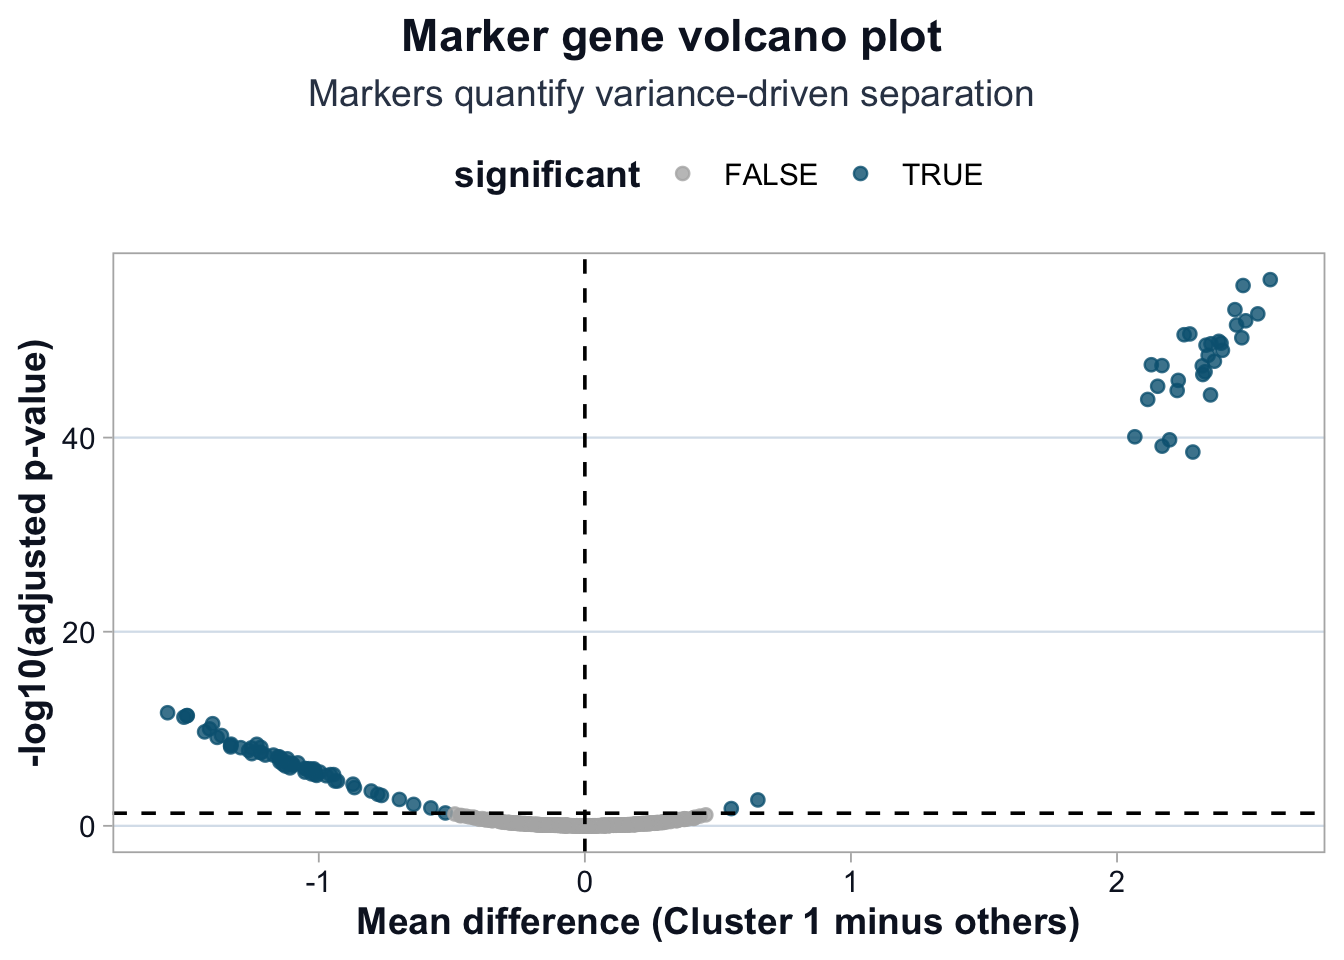
Interpretation
This plot reflects the same variance logic from Lesson 3 and 4.
Large absolute logFC values indicate genes contributing strongly to cluster separation.
High -log10(padj) values indicate statistical stability.
When effect size and significance align, separation is structurally coherent.
If clusters were formed by selected variance, markers must align with that same variance structure.
Marker analysis does not discover new structure.
It quantifies existing variance compression.
Variance Logic Check
If a cluster aligns with QC metrics (e.g., percent_mt),
its strongest markers may reflect:
- Stress-response genes
- Technical artifacts
- Capture bias
This is why marker interpretation must always be linked back to:
Variance selection → PCA → Clustering → Calibration.
What This Lesson Established
You now understand:
- Marker genes quantify variance-driven separation.
- Effect size and statistical evidence must align.
- Strong markers reflect structure already present in PCA space.
- Marker analysis does not replace calibration.
Clusters are hypotheses.
Markers are quantified variance.
Interpretation requires discipline.